The setup, so you can repeat it
The model is MiniMax H3, specifically the first/last-frame checkpoint (FL2VA), run locally on an Apple Silicon Mac through a fork of h3.c, with an INT8 copy of the transformer and an 8-step Turbo LoRA from lightx2v (fl2v_turbo_8step_v1.0_768p). Every clip is the same: 768x1344, 124 frames, 8 steps, seed 42, conditioned on a first frame only.
The chain itself is one ffmpeg line. Take the last frame of clip one, save it as a PNG, and feed it to clip two as its first frame. Repeat. Three subjects were run this way: a woman in an armchair for ten clips, a man by a door for seven, and a woman with a phone for nine. Each prompt gave the person one line of dialogue, which the model voices, and every prompt asked for a static camera and natural skin texture. That last instruction matters later.
The measurement is the part worth copying. On the first frame of each clip, the tester computed four whole-frame numbers and divided each by its value on the drawn keyframe he started from. Edge sharpness is Laplacian variance, the variance of a Laplacian filter. Finest-detail share is FFT energy above 0.25 cycles per pixel divided by FFT energy above 0.01 cycles per pixel. Contrast is the standard deviation of pixel values. Near-white is the share of pixels above 0.92. The measurement itself needs none of that: it runs on the PNG files the chain already produces. Matching the tester's exact values, though, means matching his metric definitions and image-processing steps.
Detail goes first, and it goes immediately
There is no grace period. The finest detail fell on the first link, to 77% of the keyframe in the armchair chain and 80% in the door chain at the start of clip 2. It kept falling to a low at clip 4, 61% and 65%, and it never climbed back to where it started. The first chain ended at 65%. The second ended at 88%, closer, but still short.
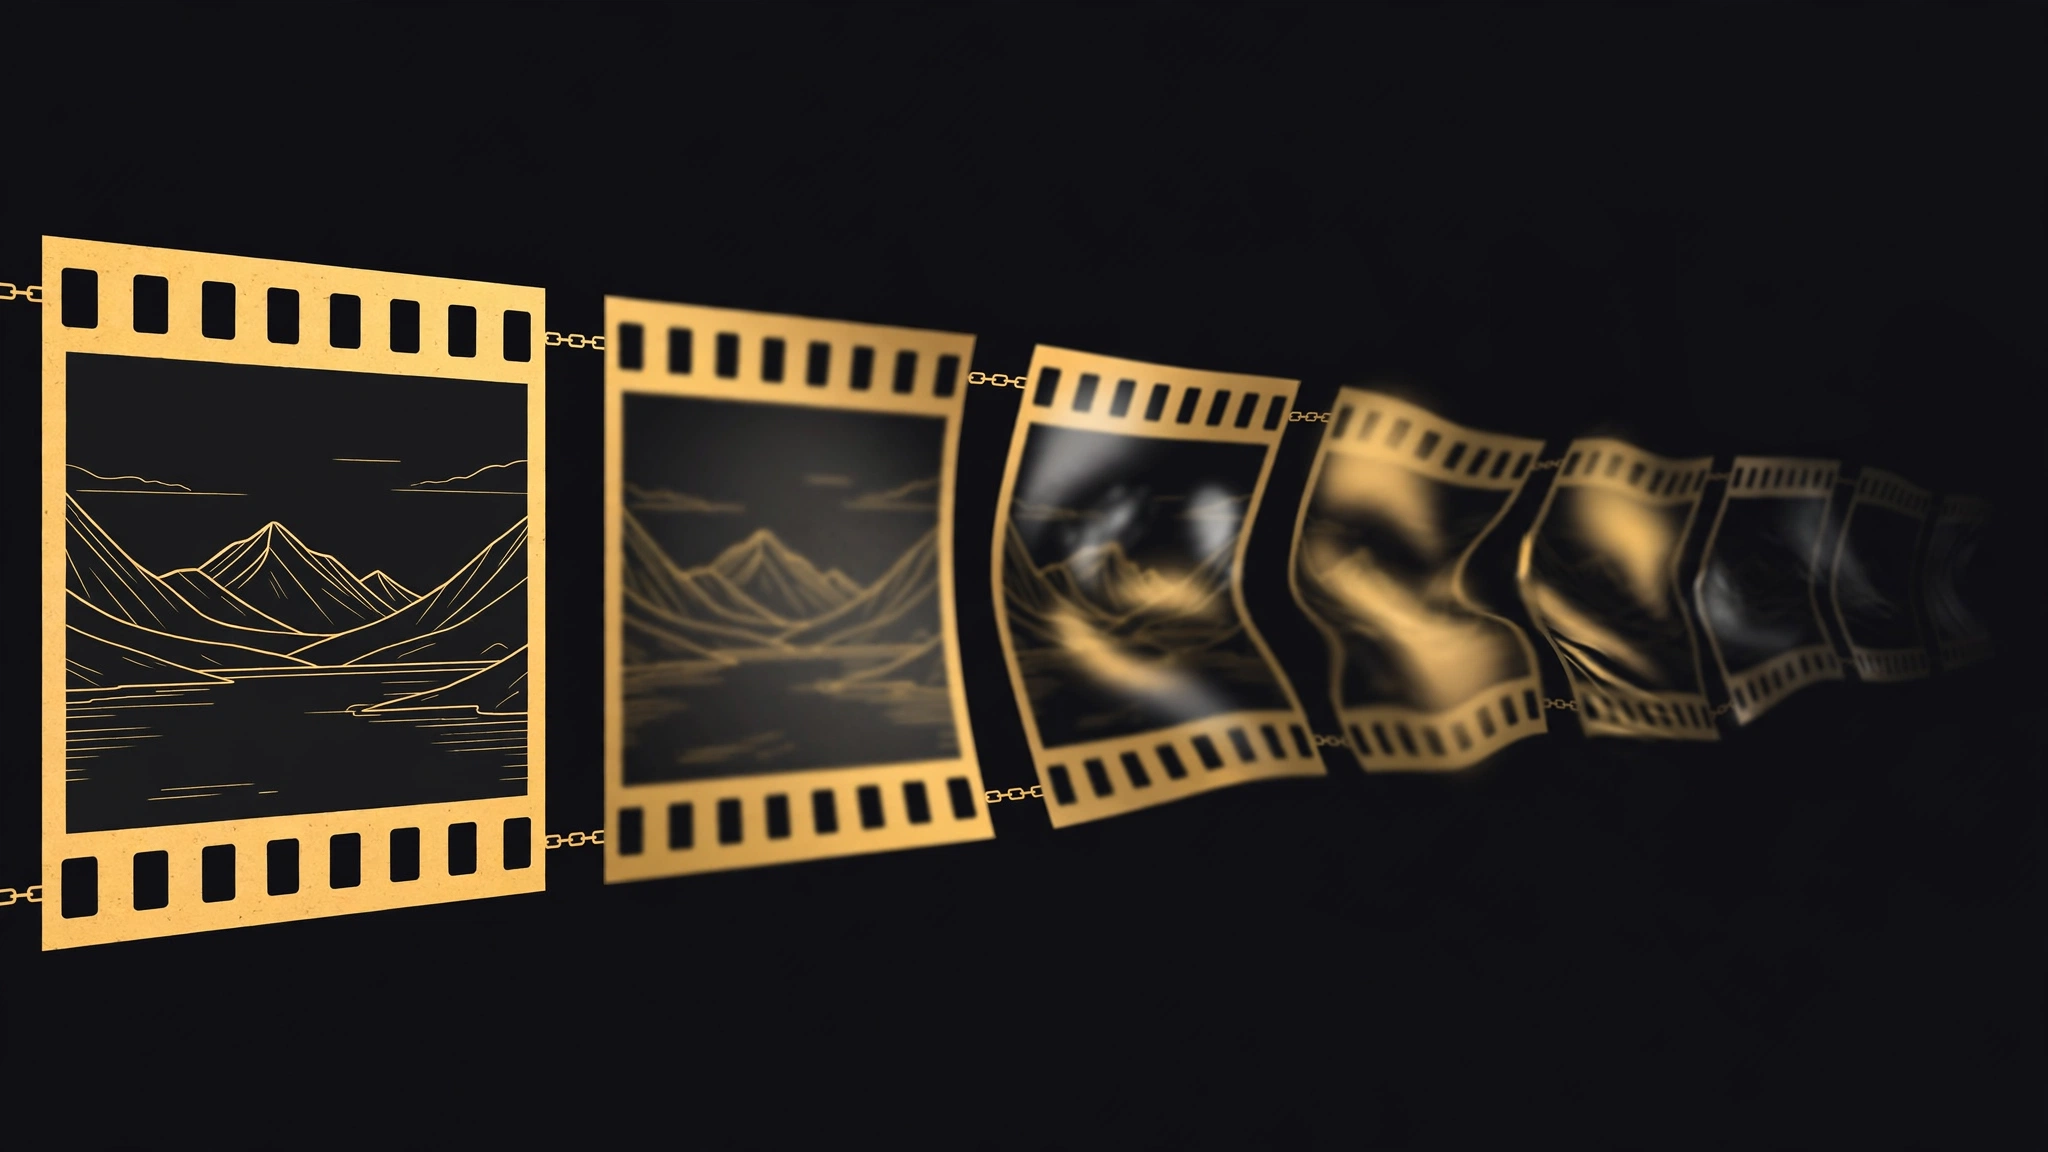
If you take one number from this test, take that shape. The loss is front-loaded. A chain does not stay clean for five clips and then fall apart. It pays most of its detail cost before you have finished your second generation, which is exactly when a quick preview still looks fine.
The sharpness number lies to you
Edge sharpness did something less intuitive. It fell at first, to 73% and 82% at clip 3, and then it overshot. From clip 5 onward it sat above the keyframe, and it finished at 174% in one chain and 159% in the other.
Read alone, that looks like recovery. It is not. The finest-detail share stayed below the keyframe level even as edge sharpness rose. The two metrics therefore tell different stories: the frame developed stronger edge responses without recovering its original share of the finest spatial detail. The tester's visual example is a crunchy pattern appearing on shirts that the original drawing did not have.
This is the practical trap in chained generation. The quick human check, and the quick metric check, is "does it still look crisp". In a long chain the answer can be yes while the image is getting worse. If you measure one thing, measure the finest detail, not the sharpness.
Then the faces turn oily
Contrast climbed with almost every link, up 14% in one chain and 16% in the other. Near-white pixels climbed faster: from 0.20% to 0.55% of the frame in the armchair chain, close to triple, and from 0.054% to 0.124% in the door chain.
On a background, those numbers are abstract. On a face they are not. Contrast and near-white pixel share rose across the frame. In the tester's visual inspection, the faces also became shinier, with a glossy or oily appearance around the forehead, nose and cheeks. The tester describes the faces as looking oiled. The details that make a drawn face a specific face went early: the freckles were gone by clip 4, the skin was glossy even though every prompt asked for natural skin texture, and by clip 9 the bone structure had changed.
Keep one distinction straight. The shine is measured. The changed bone structure is the tester's visual judgment, and he says so himself: he did not score identity with a face-embedding model. Treat the identity drift as an observation that matches the measured trend, not as a fifth metric.
There is also one unexplained data point, and it is left unexplained here for the same reason the author leaves it unexplained. The first frame of the armchair chain's clip 10 came out brighter overall, overall brightness up 10% and saturation down 15%, which pulls its contrast and shine numbers back down. Why is not established. A chain long enough will produce surprises its own measurement cannot yet account for.
Mistakes ride along, permanently
The third chain failed a different way, and it may be the most useful failure of the three.
At the end of its second clip, the model drew a chat bubble, filled with made-up English, over the frame. Clip 3 started from that frame, because that is what a chain does. So the bubble was part of the scene from then on. It stayed for the next seven clips. The text inside it changed from clip to clip. The bubble itself never left.
The mechanism is worth stating plainly because it generalises beyond bubbles. The model treats whatever sits in the conditioning frame as part of the scene it is continuing. A last-frame chain has no step at which anything gets removed. Every artefact a clip invents, a stray object, a warped hand, a piece of nonsense text, becomes source material for everything after it. Quality loss in these chains was gradual. Error adoption was immediate in the observed case: once the bubble entered the conditioning frame, it remained part of the scene in every subsequent clip tested.
The three-clip rule
The workflow the tester uses now has three parts.
First, at most three clips in a row start from a previous clip's last frame. Then the chain restarts from a fresh drawn keyframe.
Second, entrances get a hybrid. If a new person or object enters, the clip still starts from the last frame, for continuity, but it ends on a freshly drawn end keyframe: an edit of the start frame with the new detail painted in. The chain is anchored at both ends instead of drifting from one.
Third, some shots never chain at all. A face close-up, or a new location, always starts from a freshly drawn keyframe.
Be clear about what the number three is. The author calls it a judgment call, not a threshold his numbers found, and the body of this tutorial will not upgrade it into one. His reasoning is visible in the data: across the first three clips, fine detail fell to 66% and 69% in the two chains, while contrast had barely moved, at 100% and 106%, and near-white pixels were up only 16% and 11%. In the two measured chains, the metrics increasingly diverged from the keyframe as generation continued, particularly from clip 5 onward. The pattern was not perfectly monotonic: clip 10 in the armchair chain showed an unexplained change in brightness and saturation. That is a reasonable place to draw a line. He also notes, fairly, that you could argue for two.
Check your own chain with a short script
You can run the same kind of check on your own chain without generating new clips. The calculation uses saved frames, although reproducing the tester's exact values requires matching the original metric definitions and image-processing steps.
1. Save the first frame of every clip in your chain, the same PNGs you already feed the model, plus the original keyframe.
2. Compute the four numbers on each one, from the definitions in the setup section above: edge sharpness as Laplacian variance; finest-detail share as FFT energy above 0.25 cycles per pixel divided by energy above 0.01; contrast as the pixel standard deviation; near-white share as the share of pixels above 0.92.
3. Divide each frame's numbers by the keyframe's. You are looking for one pattern: finest detail falling while contrast rises. That pairing is the chain going glossy and coarse at the same time.
4. Build a contact sheet, the first, middle and last frame of every clip side by side, and actually look at it. The measurement would not have caught the chat bubble as a problem. The contact sheet would have, at clip 3, instead of in a rough cut several clips later.
5. When the pattern appears, restart from a fresh keyframe rather than chaining one more clip and hoping.
What this test does not show
It is two clean measured chains, plus one mistake case, on one model, at one seed, at one resolution, with metrics taken across the whole frame while people move inside it. It does not measure LTX, Wan or Seedance chains, even though forum reports describe the same drift there, and it does not measure identity with an embedding model. A different model, a higher resolution, or a workflow that supplies an end frame as well as a start frame could produce a different curve.
What this test shows is narrower: in two measured MiniMax H3 chains, the finest-detail share fell from the first link, while edge sharpness later rose above the keyframe level. A third chain showed one invented chat bubble persisting through subsequent clips. Based on those observations, the tester recommends limiting last-frame chains to three clips before returning to a fresh keyframe. That is a practical heuristic to test on your own workflow, not a threshold established by the experiment.
Inspiration note: this tutorial is ALFW's editorial rewrite of the method, measurements and working rule in Rodion's October 29, 2026 post, cited in the sources above. The test and the numbers are his; the framing and the checks are ours.
Sources
- [1] Rodion, "Chaining image-to-video clips from the last frame: what 10 links did to a face (MiniMax-H3, measured)", originally published at DEV on October 29, 2026, republished on MediumRead source
- [2] MiniMax H3 model specifications (first/last-frame and Omni Reference modes, 24 fps, native stereo audio), MiniMax documentation summaryRead source